Projects
Calgary Rezoning Analysis
In 2023 I wrote "A Manufactured Crisis"a community research report on how financialization transforms housing into investment assets. I recommended aggressive rezoning as one of five policy solutions.
When Calgary actually implemented blanket rezoning in 2024, I came back to measure what happened. The answer surprised me: construction starts dropped 16% after deregulation. The opposite of what the policy was supposed to do. I used Interrupted Time Series analysis on CMHC data to test whether the policy caused the change, or whether I was just seeing noise.
The research caught attention from University of Calgary faculty and started conversations about how we actually evaluate whether policies work.
HR Turnover Tool
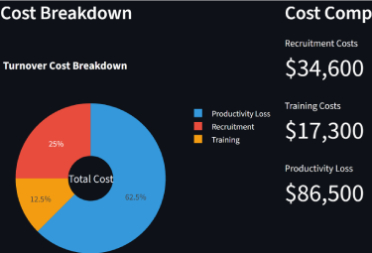
Direct support professions have brutal turnover, 40-45% at the organization I worked for. Everyone treats it as inevitable and I was given the chance to analyze it. I wanted to know: what does that actually cost? And can you see it coming?
Built a Streamlit dashboard that surfaces turnover costs and flags at-risk employees. The model estimated ~$250K in annual turnover costs, which made retention investments easier to justify. Most turnover occurred in months 3-6 (the onboarding failure window), which indicates where to focus. A modified version is currently in use by senior leadership; this app has a Sankey diagram, however.
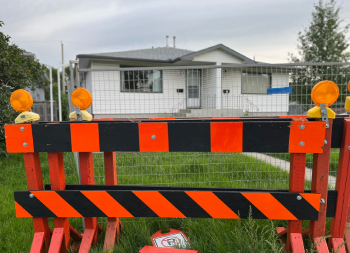
FleetTracker
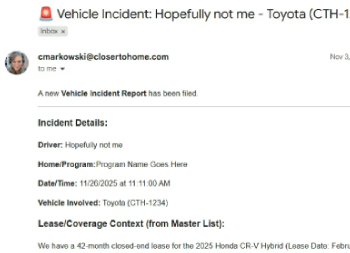
Nonprofits manage vehicle fleets with email chains and scattered spreadsheets. I had to scan manually, vehicle incident forms, leases, and service files, and I wanted a better way. Incident reports also get lost, coverage gaps go unnoticed, and insurance claims take forever because nobody can find the documentation.
I built a system that runs entirely on Google Workspace, zero servers, zero hosting costs. Form submission triggers automated folder creation, email notifications, and coverage lookups. Claims processing went from 3-5 days to same-day. I designed it so someone non-technical could maintain it after I leave.